Volume 1, Issue 2
Article Type: Research Article
A novel CNN architecture: Comprehensive approach to alzheimer’s disease detection and classification
Indhumathi G1*; Palanivelan M2
1Assistant Professor, Department of ECE, Rajalakshmi Engineering College, Chennai, India.
2Professor, Department of ECE, Rajalakshmi Engineering College, Chennai, India.
*Corresponding author: Indhumathi G
Assistant Professor, Department of ECE, Rajalakshmi
Engineering College, Chennai, India.
Email ID: Indhumathi.g@rajalakshmi.edu.in
Received: Sep 05, 2025
Accepted: Oct 13, 2025
Published Online: Oct 20, 2025
Journal: Annals of Gerontology and Geriatrics
Copyright: Indhumathi G et al. © All rights are reserved
Citation: Indhumathi G, Palanivelan M. A novel CNN architecture: Comprehensive approach to alzheimer’s disease detection and classification. Ann Gerontol Geriatr Res. 2025; 1(2): 1024.
Abstract
Alzheimer’s Disease is recognized as a neurological disorder that damages the tissues of the brain, causing long-term memory loss, cognitive difficulties, confusion, inconsistent behavior, and ultimately death. In this study, we identified the three broad stages of this neurodegenerative disease: Non-Demented (Normal), very mild (early stage), mild (middle stage), and moderate demented (late stage). The treatment for the AD symptoms can greatly benefitted from the early identification and categorization. DL and ML techniques are applied. The dataset is obtained from the ADNI and Kaggle research data sharing platforms. By using Visual Studio code in Anaconda Navigator, the source code is tested, and Google Colab is used for the model training. The study’s findings showed that, using the test dataset, we could effectively and accurately categorize the stages of AD with a 98.02% accuracy rate. This test’s accuracy score is noticeably greater than that of previous studies. The findings also showed that these methods can be effectively applied in the medical field to aid in early disease diagnosis and identification.
Keywords: Memory loss; Neurodegenerative disease; ADNI; Deep learning; Accuracy.
Introduction
The decline of cognitive ability and memory loss are the main two symptoms of neurological disorders like AD which is named after Dr. Alois Alzheimer initially described in 1906. The disease primarily affects older individuals, though early-onset cases exist [2]. Symptoms include memory impairment, confu- sion, difficulty in problem-solving, and behavioral shifts. As the disease advances, individuals may struggle with daily tasks, lose language skills, and experience personality changes [4]. The Ongoing study aims to understand the condition better, which helps to investigate potential prevention strategies and also creates more effective treatments. Diagnosis involves compre- hensive medical evaluations, including cognitive tests and im- aging studies [12]. This disease is difficult to identify early and involves a lot of effort and money. Advanced prediction tools, extensive data gathering, and the expertise of a clinician are all necessary for successful early detection [7]. Automation lowers total expenses while increasing accuracy.
Image processing and applications in disease detection
MRI scanner produces three-dimensional images of the hu- man body, which are often utilized for diagnosing the disease and provide guidance in the medical treatments like surgical intervention and research in the domain of medical image pro- cessing.[6]. PET-MRI and Positron Emission Tomography are two modern imaging techniques that heavily rely on picture regis- tration and fusion algorithms. Medical imaging is essential for monitoring the progression of a chronic illness [21]. Doctors keep an eye on how well their patients are responding to treat- ment plans and change as needed depending on results from imaging tests, like CT and MRI scans [22].
Symptoms of AD affecting the CNS
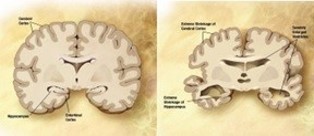
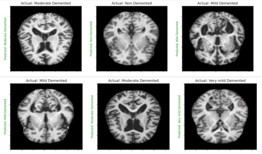
Alzheimer’s starts in the central nervous system and pro- gresses slowly from there. AD is characterized by decreasing ar- eas of the brain, damage to tissue cells, and the breakdown of neuronal connection links [18]. Tangles and amyloid plaques ac- cumulated in the brain are also thought to be a characteristic of AD. Studies of brain metabolism using MRI and PET, along with other imaging modalities, have revealed distinctive alterations in AD patients [3]. Figure 1 displays an MRI of a brain affected by AD and a normal brain [1]. Artificial intelligence has a significant role in the diagnosis of AD.
Motivation
Standard measures and human instinct do not always agree in the contemporary environment. We must use cutting-edge, non-traditional, and computationally intensive techniques such as ML to address this issue [1]. This drift not only enhances pa- tients’ quality of life but also helps health economists and doc- tors make assessments and treatment decisions. Finding the knowledge gaps and possible opportunities related to ML and DL frameworks and data obtained from Electronic Health Re- cords (EHRs) is the aim of this project [12].
Literature survey
Research papers studied in ML
1. “ML approaches for detection and classification of AD: A review” by S. A. Hane, et al. Published in: Psychiatry Research: Neuroimaging, 2017. The study examines ML techniques used in identification and categorization of AD.
2. “AD Neuroimaging Initiative (ADNI): A review of methods, challenges, and opportunities” by M.W.Weiner, A.Veitch,et al. Published in Neuroimage, 2018. This paper discusses opportunities and challenges, offering insights into the data used for ML studies.
3. “ML in predicting progression of AD: An overview” by D.K.I. Christodoulopoulos, et al. Published in Journal of AD, 2020. This paper explains the role of ML in predicting the progression of AD.
4. “ML techniques for the diagnosis of AD: A review” by O. A. Alhussein, I. I. Hussein, et al. Published in the King Saud UniversityComputer and Information Sciences journal, 2020. This shows various ML techniques including such as ANN, KNN, SVM and ensemble methods.
Research papers studied in deep learning:
1. “Automated diagnosis of ADwith multi-scale convolutional neural networks using resting-state functional magnetic resonance imaging” by Suk, Heung-Il, et al. Published in PLoS One, 2014.Accuracy achieved is 94.87%.
2. “Deep Learning-based AD Classification Using Novel Feature Selection and Voting Ensemble” by Sarraf, Saman, and Ghassem Tofighi. Published in BioMed Research International, 2016. The model obtained an accuracy of around 89.2%.
3. “3D convolutional neural networks for classification of functional magnetic resonance imaging data for AD detection” by Sarraf, Saman, and Ghassem Tofighi. Originally published in the 2016 IEEE Conference on CVPR Proceedings. Accuracy achieved is 84.3%.
4. “DL for the diagnosis of AD: a systematic review and metaanalysis of longitudinal studies” by Liu, Shui-Hua, et al. Published in Frontiers in Aging Neuroscience, 2018. Summary of This paper provides an overview and meta-analysis of DL techniques employed for the prediction of AD.
Research papers studied in hybrid:
1. “A hybrid approach for the early diagnosis of AD” by H. M. El-Bakry, A. A. Hassanien, et al. Published in Expert Systems with Applications, 2015.This paper presents a hybrid approach combining fuzzy logic and genetic algorithms for the early AD prediction.
2. “Hybrid model for efficient diagnosis of AD using ANFIS and K-means based segmentation on structural MR images” N. M. Khan, M. M. Palaniappan, et al. Published in Journal of Neuroscience Methods, 2017. The paper proposes a hybrid model developed which combines both ANFIS and K-means segmentation.
3. ”A hybrid approach for early diagnosis of AD using structural MRI” by R. Dhanalakshmi, V. Sridevi, et al. Published in Journal of Medical Systems, 2018. The study introduces a hybrid approach using a combination of various ML methods for early diagnosis of AD, with a focus on structural MRI.
4. ”A hybrid decision support system for AD using bayesian complementary learning from data” by A. A. Hassanien, A. E. Hassanien, et al. Published in Cognitive Computation, 2019. This paper proposes a hybrid decision support system for AD utilizing Bayesian complementary learning from data, demonstrating improved diagnostic accuracy.
Block diagram
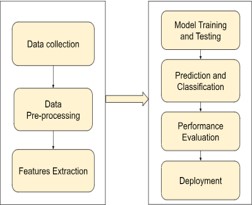
The figure 2 shows the DL workflow which comprises of the data collection followed by the pre-processing techniques and feature extraction. The pre-processed dataset is splitted and the model training is done [10]. The trained model is used for model validation and prediction. DL algorithms like ResNet-169, EfficientNetB2, CNN algorithm is utilized for the model classification and finally for the performance evaluation is done and deployment takes place.
Data collection
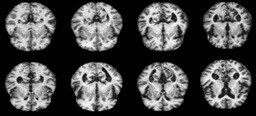
Dataset was collected from ADNI and Kaggle which is the public data source. The dataset can be in the form of Image and statistical data [3]. In this project we use MRI imaging since the PET and CT scan can produce the radiation that can cause the side effects and using MRI images can be a non-invasive method to detect AD [4]. ADNI and Kaggle Provided the MRI images for this study. T1-weighted Magnetic Resonance Imaging (MRI) images are used since it enhances the signal of the fatty tissues and suppresses the signal of the water [3]. A total of 1280 images were collected from ADNI and kaggle in which 322 images are non-demented, 311 very mild demented, 364 mild demented and 283 moderate demented.
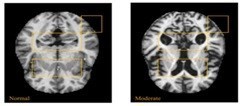
In AD affected brain the ventricles in center of the region enlarges and the cortical gray area in the corners of the brain reduces [9].
Non-demented very mild mild moderate
Data pre-processing
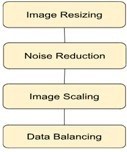
The figure 5 shows the data pre-processing steps. The AD dataset is processed by slicing, image scaling, noise reduction, histogram equalization, and low-pass alpha-trimmed filtering. The contrast of an image is improved using the histogram equalization. To acquire the necessary image size (128×128), resizing is done. To improve the model’s efficiency, these are further downscaled [4]. Subsequently, downscaling is carried out to downscale the dimensionality of the data and increases the feasibility of training the DL algorithm on it. Using GANs (Generative Adversarial Networks), the model’s prediction of the imbalanced data is made more accurate and also limits conventional methods such as overfitting [4].
By lowering noise, filtering enhances the quality of the images. Using an alpha-trimmed filter, the noise in the images is reduced [3].
The equation (1) shows the alpha-trimmed filter,
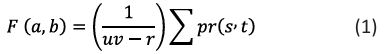
where, F represents the filtered images, (a, b) are the coordinate of the pixels processed, uv is the dimension of the filter, pr is the set of pixels left r is the nod of pixels that will be excluded after averaging [3].
The filter dimensions in our implementation have a mn of 5×5 and a dimension d of 8. This indicates that we removed 8 pixels out of 25 pixels, 4 from the start and 4 from the end [3].
Features extraction
The algorithm may find it challenging to handle the raw data accurately if the raw data contains a large number of extraneous features [12]. Feature extraction, a step in the process of reducing dimensionality, involves dividing the initial raw data set into smaller, more manageable groups. The purpose of feature extraction is to precisely extract a feature from the images and correlate it so that the algorithm can analyze the data appropriately [13,25].
In this study we are extracting the features such as D1, D2, αmin, αmin, αmax, f(αmax), Spectrum width, Symmetrical shift, apparent area of the brain.
The deep features D1, D2 are of no use in terms of physical characteristics [14]. These features reduce the amount of information lost during input-output mapping.
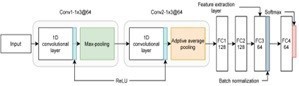
Feature Extraction Process using CNN algorithm includes convolutional layers, depthwise and pointwise separable convolution and Class Active Mapping (CAM).
1. Convolutional layers: They facilitate the MRI’s local feature extraction. It can distinguish edges, textures, and other regional patterns that are essential for diagnosing the brain alterations associated with AD.
2. Depth wise separable convolutions: They use fewer parameters and require fewer computing costs. By splitting the convolution operation into depthwise and pointwise convolutions, it is able to extract more abstract features.
3. Class activation mapping (CAM): It facilitates the visualization of the MRI scan regions that the model uses to make a diagnosis. It is especially useful for figuring out which parts of the brain are most predictive of AD. It offers helpful data on the course of the illness and possible treatment objectives.
Area of the brain:
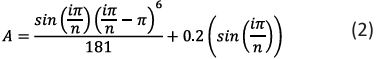
In equation (2) n indicates the total number of copies that are based on the scale a and i denotes the fractal unit. The Class Activation Mapping (CAM) approach is being used to calculate this. The strongest features that correspond to the brain area found in the comparison between patients without dementia and those with dementia are shown by class activation maps. ANOVA test was utilized in this investigation. Between the patient groups, a statistically significant reduction in relative cerebellum volume (p value = 0.0176) and cerebellum folding (p value = 0.0057) of large effect size was found, indicating a decrease in volume and folding as dementia progresses [20].
Information dimension:
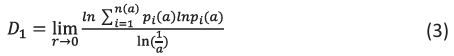
The equation (3) shows the information dimension that describes how quickly information is lost over time or acquired through a series of measurements. From equation (3), n(a) is the total number of fractal copies that are based on the scale a, Pi(a) is the growth probability function of the ith fractal unit and the order of moment is denoted as q.
Correlation dimension:
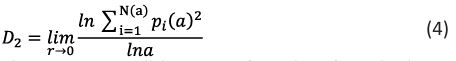
The structure will be mono-fractal or fractal when D1=D2, and a multifractal when D1>D2.
Singularity spectrum:
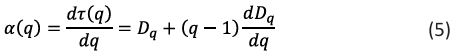

The symbol f (α) represents the fractal dimension of the fractal units of a particular size, and α (q) is the related singularity exponent. It is possible to apply warping filters to the image and utilize them to highlight subtle characteristics. The symbol (q) represents a set of exponents that make up these warp filters.
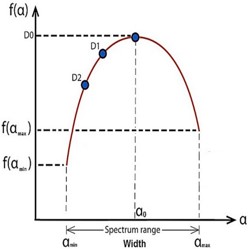
From the figure 7, The dimensions D1 and D2 are information and correlation, respectively [14]. α0 is the the local dimension at the maximal singularity spectral curve, αmin is the local minimum dimension, f(αmin) is the singularity spectrum’s beginning value, αmax the largest local dimension, f(αmax) is the singularity spectrum’s final value, W is the singularity spectrum’s width, The singularity spectrum curve’s symmetric shift, The apparent region of image (A)’s brain segment [10].
Table 1: Table of features.
| Feature of Image | Non-Demented | Very Mild stage | Mild Stage | Moderate stage |
|---|---|---|---|---|
| Symmetrical shift | 0.289+-0.062 | 0.796+-0.042 | 0.974+-0.079 | 1.175+-0.069 |
| Brain area | 17.71+-0.158 | 15.46+-0.151 | 13.47+-0.148 | 11.31+-0.207 |
| F alpha minimum | 1.542+-0.072 | 1.481+-0.027 | 1.383+-0.097 | 1.37+-0.082 |
| F alpha maximum | 0.294+-0.078 | 0.196+-0.018 | 0.244+-0.042 | 0.122+-0.014 |
| D1 | 1.69+-0.016 | 1.62+-0.021 | 1.58+-0.032 | 1.453+-0.018 |
| D2 | 1.42+-0.020 | 1.39+-0.021 | 1.36+-0.028 | 1.33+-0.032 |
| Spectrum width | 0.672+-0.062 | 0.562+-0.07 | 0.45+-0.092 | 0.423+-0.102 |
The table 1 shares the information of the attributes. D1=1.63 indicates that there are some morphological alterations in the brain image as a result of increased beta-amyloid deposits that result in the accumulation of amyloid plaques and (T-tau) which cause the brain to shrink. D2 is the correlation between two pixels in the scanning box; for the sample image provided, the data suggests that D2=1.395 denotes non-contiguous pixels, increased gaps in the image due to cell loss, and a greater decrease in the frontal lobes, temporal-parietal area, and hippocampus relative to other regions [4]. The characteristics of the singularity spectrum are as follows: The broad spectrum has a width of 0.687 and a large range of variability from αmin=1.483 to αmax=2.655. This validates the existence of numerous gaps and atrophy varying in size and shape throughout the brain’s lobes. That related to the heterogeneity zones that appeared in the brain structure. (3) The singularity spectrum’s initial value, f(αmin) =1.468, and final point, f(αmax) =0.202, show a high degree of fluctuation, indicating that the lobes of the brain are not uniformly represented in the image [20].
Model training
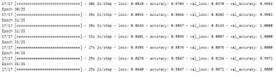
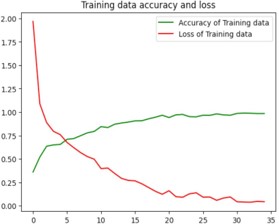
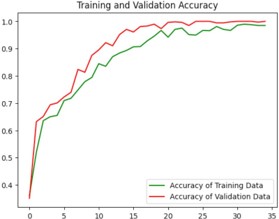
Python code has been used for the training and testing process. The code contains several libraries such as tensorflow, numpy, matplotlib, keras which is a higher-level neural networks API that comes integrated with tensorflow [1]. The loading of the training and test datasets is done using tf.keras.preprocessing.image_dataset_from_directory(). A neural network model with multiple layers is created using keras that contains convolutional, Max-pooling, Dropout and Dense layers. Sparse categorical cross-entropy loss function and Adam optimizer are used to build the model. The training process is run for 35 epochs as shown in figure 8. The loss and accuracy gained is plotted and the visualization of the test images and predictions are made which was displayed in figure9. Finally, the trained model is stored as “ALZ.h5 ‘’ in HDF5 format [12].
Identification and classification
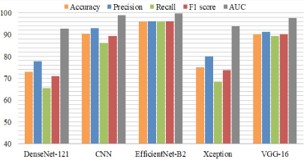
A. ResNet: ResNet is a basic model of convolutional neural network, in short Residual Networks, was created to meet the difficulties of training extremely deep neural networks [22,23]. It presents the idea of residual learning, in which the model can learn the residual (difference) between a layer’s input and output by using shortcut connections, also known as skip connections [18]. It offers an 89.6% accuracy rate.
B. DenseNet121: DenseNet architectures are often denoted by the number of layers they contain. DenseNet-121 indicates a DenseNet with 121 layers, which is a common variant. When using DenseNet for a specific task, like image classification or medical diagnosis, the model is typically pre-trained on a large dataset and fine-tuned on the target task [23]. Their dense connectivity can lead to more efficient learning and better parameter utilization compared to traditional architectures [23]. The accuracy of DenseNet is about 71% because of which it cannot be used for this prediction model.
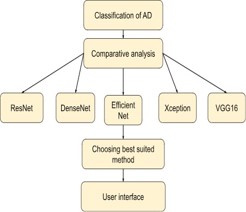
The figure 10 shows the workflow of how the comparative analysis has been carried out to select the best suited model for this case study.
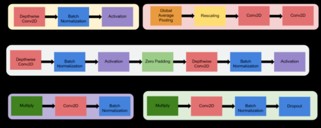
C. EfficientNetB2: Algorithm—Efficient Net-B2 is trained for classification in the standard manner. EfficientNet-B2 is a specific variant of the EfficientNet family of neural network architectures [21]. Mingxing Tan and Quoc V. Le proposed the EfficientNet models in their paper “EfficientNet: Rethinking Model Scaling for Convolutional Neural Networks” in 2019. This model provides better performance and efficiency by depth scaling, width scaling, and resolution scaling of the network in a balanced way. EfficientNet is relatively consistent with near perfect training curves and provides less loss and Peak accuracy about 97.22%. figure.11 explains the modules of the EfficientNetB0.
D. Xception: The name “Xception’’ stands for “Extreme Inception,” indicating its relationship with the Inception architecture [20]. Depthwise separable convolutions have been utilized in the Xception which is one of the DL architectures [21]. Xception employs depthwise separable convolutions, which are a factorized version of the standard convolutional layers commonly used in convolutional neural networks (CNNs). Depthwise separable convolutions split the convolution into two stages. However, Xception uses a high number of parameters and computational cost is also high compared to other models. So Xcpetion cannot be used for this prediction model as it also provides less accuracy about 71.2%.
E. VGG16: VGG16 is created by the Visual Graphics Group [27]. When the pre-trained VGG16 model is used, it acts as a tool to extract important features from data, especially in imagerelated tasks. The top layers are removed (fully connected layers) from the VGG16 model, keeping the convolutional layers [23]. Add new layers on top of the VGG16 base to adapt it for AD classification [23]. Initialize the modified VGG16 model with pre-trained weights on a large dataset. Freeze the convolutional layers of VGG16 to retain the learned features and prevent them from being updated during initial training. The computational cost of VGG16 is comparatively less than other models used, but the loss rate is significantly high and provides an accuracy of about 88.02%.
F. Comparative analysis is done for the classification of AD to choose the best suited algorithm for better efficiency and accuracy. EfficinetNetB2 is the best suited method for the classification since it provides peak accuracy about 97.22% and also significantly less loss.
Performance evaluation metrics
Examining the model’s performance with respect to a certain dataset is a crucial task. This study assessed multiple evaluation metrics which includes recall, accuracy, precision, F1 score and area under the curve [7].
A. K-Fold Cross Validation: It is a predictive model evaluation technique. After dividing the dataset into k subgroups, the model is being trained for k times. By averaging the performance measures from each fold, the model’s performance is estimated. In this case, fivefold cross-validation is used (K=5) [10].
True Positive (Tp)The percentage for predictions for which the classifier accurately associates the positive class with the positive state.[7].
True Negative (Tn)-The percentage for predictions for which the classifier accurately associates the negative class with the negative state.[7].
False positive (Fp)-The percentage for predictions for which the classifier accurately associates the negative class with the positive state.[7]. (Type 1 error)
False Negative (Fn)-The percentage for predictions for which the classifier accurately associates the positive class with the negative state.[7]. (Type 2 error)
B. Accuracy: (No of correct predictions) / (total no of predictions)
C. Precision: Tp/(Tp+Fp)
D. Recall: Tp/(Tp+Fn)
E. Area under curve:
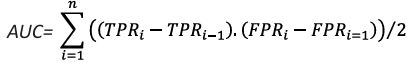
TRPi represents the ith True Positive Rate and FPRi represents the ith False Positive Rate.
The summation is over all thresholds i.
The i−1 indices represent the previous threshold.
E. F1 score: 2*(Precision*Recall)/(Precision+Recall)
F. Confusion matrix: A confusion matrix is a tool used in DL and ML, specifically for classification issues, to monitor and evaluate algorithm performance. It does this by comparing the anticipated and actual classes as shown in figure 12 [23].
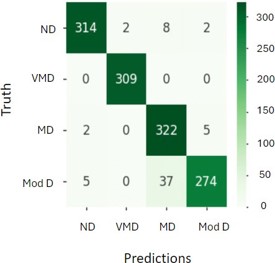
Where,
ND is non-demented.
VMD is Very Mild Demented.
Mod D is Moderate Demented.
MD is Mild Demented.
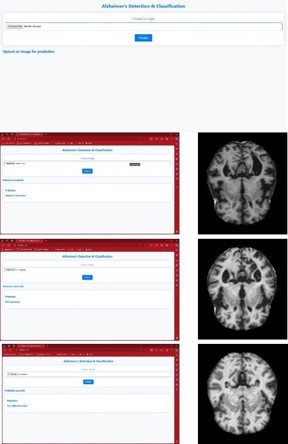
Deployment
The webpage is created using python. The figure 14 shows the web page that was created for the identification and classification of AD in which the input image can be chosen and a predict option is selected. The backend program will run and produce the result as the stages of the affected brain image.
Results and discussion
Image preprocessing and feature extraction is done based on the brightness, texture, dimension etc. Using thresholding, Augmentation, Gray scaling [13]. DL techniques and algorithms have been used for training the model, identification and classification of the Image. The results show that the trained model produces 98.02% accuracy in the prediction of the disease and classification is given as output when the input, that is MRI of the Brain is fed to the system.
Conclusion
AD is an incurable neurological disorder that mostly impairs the memory of the elderly [2]. Alzheimer’s is diagnosed and described using a variety of techniques but the precise and prompt approach is needed. To extract features from the images, we have built a model around the Convolutional Neural Network because this model is more accurate and efficient compared to other models [24]. For classification, the EfficientNetB2 model is used after the comparative analysis with other CNN models. The evaluation metrics were calculated. In this approach ADis classified into four categories: non-demented, very mild demented, Mild demented and finally moderate demented. The EfficientNet-b2 model provided better results during the testing and training phases. Using this method, Alzheimer’s illness will be analyzed and categorized in real time. Future work aims to increase the system’s disease detection accuracy by adding different measures and growing the dataset.
References
- Frozza RL, Lourenco MV, De Felice FG. Challenges for AD therapy: insights from novel mechanisms beyond memory defects. Front Neurosci. 2018; 12: 37.
- El-Geneedy M, Moustafa H, Khalifa F, Khater H, AbdElhalim E. An MRI-based deep learning approach for accurate detection of Alzheimer disease. Alex Eng J.
- Joe T, No K, Saykin AJ. Diagnostic classification and prognostic prediction of Alzheimer disease using neuroimaging data. Front.
- Fulton LV, Dolezel D, Harrop J, Yan Y, Fulton CP. Classification of Alzheimer disease with and without imagery using gradient boosted machines.
- Chitradevi D, Prabha S. Analysis of brain subregions using optimization techniques and deep learning methods in Alzheimer disease. Appl Soft Comput. 2020; 86: 105857.
- Khan FA, Butt AUR, Asif M, Ahmad W, Nawaz M, Jamjoom M, Al Abdulkareem E. Computer-aided diagnosis for burnt skin images using deep convolutional neural networks. Multimed Tools Appl. 2020.
- Kundaram SS, Pathak KC. Deep learning-based Alzheimer disease detection. In: Proceedings of the Fourth International Conference on Microelectronics, Computing and Communication Systems. Singapore: Springer. 2021: 587-597.
- Knopman DS, Amieva H, Petersen RC, Chételat G, Holtzman DM, Hyman BT, et al. Alzheimer disease. Nat Rev Dis Primers. 2021; 7: 1-21.
- Nawaz H, Maqsood M, Afzal S, Aadil F, Mehmood I, Rho S. A deep feature-based real-time system for Alzheimer disease stage detection.
- Elgammal YM, Zahran MA, Abdelsalam MM. A new strategy for early detection of Alzheimer disease stages using multifractal geometry analysis with K-nearest neighbor algorithm. Sci Rep.
- Pasnoori N, Flores-Garcia T, Barkana BD. Histogram-based features track Alzheimer progression in brain MRI. Sci Rep.
- Mahmud SMH, Ali MM, Shahriar MF, Al-Zahrani FA, Ahmed K, Nandi D, et al. Detection of different stages of Alzheimer disease using CNN classifier. Tech Sci Press.
- Altwijri O, Alanazi R, Aleid A, Alhussaini K, Aloqalaa Z, Almijalli M, et al. Novel deep learning approach for automatic diagnosis of Alzheimer disease from MRI. MDPI.
- Goceri E. Diagnosis of Alzheimer disease with Sobolev gradientbased optimization and 3D convolutional neural network. Int J Numer Methods Biomed Eng. 2019; 35: e3225.
- Spasov SE, Passamonti L, Duggento A, Liò P, Toschi N. A multimodal convolutional neural network framework for prediction of Alzheimer disease. Conf Proc IEEE Eng Med Biol Soc. 2018: 1271-1274.
- Kavitha C, Mani V, Srividhya SR, Khalaf OI, Romero CAT. Earlystage Alzheimer disease prediction using machine learning models. Front.
- Zhang F, Petersen M, Johnson L, Hall J. Recursive support vector machine biomarker selection for Alzheimer disease. J Alzheimers Dis. 2021; 79: 1691-1700.
- Yang BH, et al. Classification of Alzheimer disease from 18F-FDG and 11C-PiB PET imaging biomarkers using support vector machines. J Med Biol Eng. 2020; 40: 545-554.
- Vichiani Y, et al. Accuracy of support vector machines for diagnosis of Alzheimer disease using brain volume from structural MRI. Front Neurol. 2021; 12: 640696.
- Shahparian N, Yazdi M, Khosravi MR. Alzheimer disease diagnosis from fMRI images based on latent low rank features and support vector machine. Curr Signal Trans Ther. 2019; 16: 171-177.
- Suwalska A, Siuda J, Kocot S, Zmuda W, Rudzinska-Bar M, Polanska J. Activation maps of convolutional neural networks as a tool for brain degeneration tracking in early diagnosis of dementia in Parkinson disease based on MRI.
- Indhumathi G, et al. Improving tumor diagnosis accuracy with CNN-based image segmentation and Arduino decision support. In: 2023 4th IEEE Global Conference for Advancement in Technology (GCAT). Bangalore, India. 2023.
- Renugadevi R, et al. Deep learning-based gym monitoring system using YOLOv5 and pose estimation algorithm. In: 2023 7th International Conference on Electronics, Communication and Aerospace Technology (ICECA). 2023: 697-702.
- Suresh HR, et al. Unsupervised deep learning approaches for anomaly detection in IoT data streams. In: 2023 4th International Conference on Smart Electronics and Communication (ICOSEC). 2023: 438-443.
- Raman R, et al. Role of image processing in modern healthcare: a review of techniques and applications. Eur Chem Bull. 2023; 12: 4463-4474.